

![]()
![]() In this work period we worked on the following activities:
In this work period we worked on the following activities:
1) Testing the activation effects of the high frequency cold plasma on the surfaces of some polymeric materials, with the aim to improve their adhesion properties.
2) Testing the cleaning effect of the high frequency cold plasma on metallic surfaces. Obtaining hydrophobic/hydrophilic surfaces with the aim to improve corrosion and/or wear resistance of metallic surfaces
[ 1 ] In order to test the activation effect of the high frequency cold plasma on the surfaces of polymeric materials we performed a comparative study using the plasma reactor designed and built during the this project and a comercial plasma cleaning system, built by Diener Electronic, the "Zepto" model. In this test we activated the surfaces of polyethylene samples in the cold plasmas generated by the two systems mentioned above, and we compared the effects by performing contact angle measurements and bonding strength tests on the samples bonded with epoxy resin. The surface morphology of the activated samples was studied by AFM technique (NSG30-A, NT-MDT) using one of the atomic force microscopes available in our institute (INCDTIM Cluj-Napoca). In this test we also studied the effects of the drive signal frequency which generates the plasma discharges, on the surface activation properties. Table 1 presents the test conditions and the equipment we used.
Parameter |
INCDTIM Cold Plasma Reactor |
Diener Electronic Zepto |
|
Drive |
1000 kHz |
40 kHz |
|
Input power |
80 W |
80 W |
|
Process gas |
Aer |
Aer |
|
Treatment pressure |
0.4 milibar |
0.4 milibar |
|
Device picture |
|
|
|
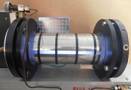
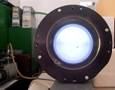
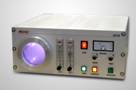
Tabelul 1. Conditiile si parametri testului.
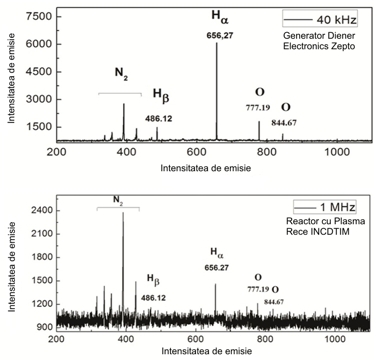
The diagnostics of the two plasmas was performed by means of optical emission spectroscopy using an Ocean Optics HR4000 type spectrometer (200...1100 nm) and the analysis applications "Spectra Suite" and "Spectrum Analyzer".
Figure 1 presents the recorded emission spectra of the two plasmas generated at 1000 kHz (INCDTIM Cold Plasma Reactor) and 40 kHz (Diener Electronics Zepto reactor).
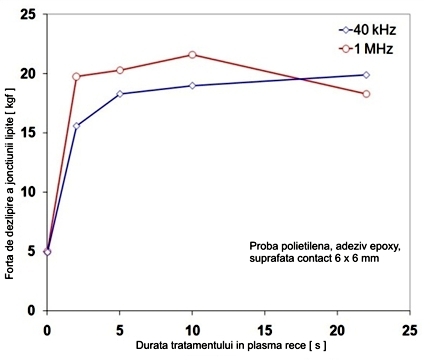
Figure 2 presents the results of the bonding strength tests we performed on PET samples with surfaces activated in cold plasmas generated at 1000 kHz and 40 kHz. For the bonding of the samples we used 2 component epoxy glue ("Polxipol") and the curring time was 20 minutes.
 |
 |
|---|---|
| Figure 1. Emission spectra for the plasmas generated at 40 kHz and 1000 kHz. | Figure 2. Force needed to separate the bonded samples with surfaces activated in cold plasma at 1000 kHz and 40 kHz. |
An important conclusion of this test is that the bonding break effort increases to about 4 times for the samples which had the surfaces activated in cold plasma prior to bonding, compared to a sample with no plasma activation.
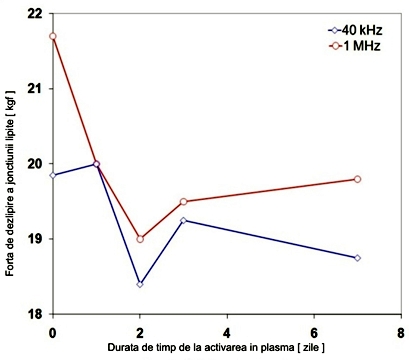
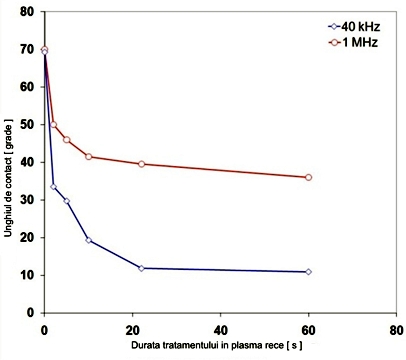
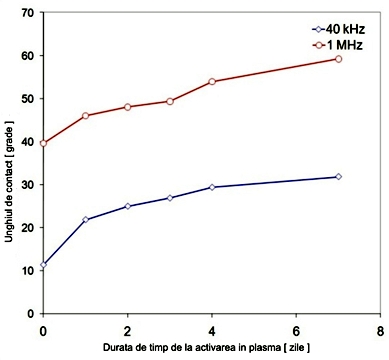
In order to study the duration for which the sample surfaces keep their properties, we performed an "aging test" on the plasma activated samples. The bond strength was measured right after the plasma activation process, and then after 1, 2, 3 and 7 days. The samples used in this test were plasma treated for 20 seconds prior to bonding. The results are presented in the graphs from Figure 3. The increase of the surface energy for the plasma activated samples was revealed by measuring the contact angle of a distilled water droplet set on the surface. Figure 4 presents the variation of the contact angles as a function of the plasma activation time, and Figure 5 presents the contact angles as a function of the time passed after the plasma activation process.
 |
 |
 |
|---|---|---|
Figure 3. Time evolution of bonding strength for the cold plasma activated samples. |
Figure 4. The variation of the contact angle as a function of the cold plasma treatment time for the two cases (1000 kHz and 40 kHz). |
Figure 5. Variation of contact angle as a function of the time passed after the plasma activation, for the two cases (1000 kHz and 40 kHz). |
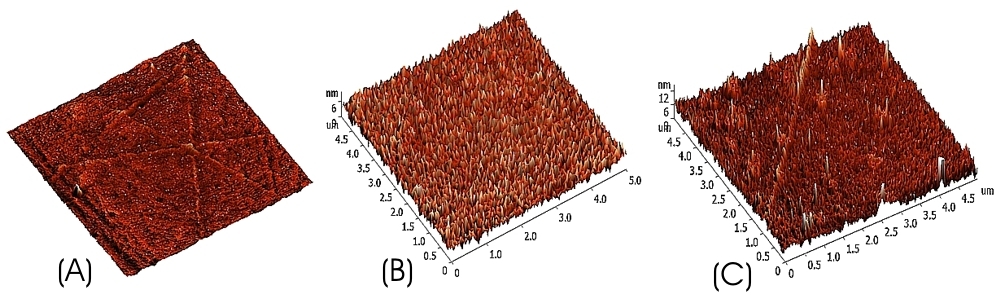
The morphology of the polyethylene samples (untreated, and plasma treated at 1000 kHz and 40 kHz) was studied by means of AFM technology. The results are presented in Figure 6.
 |
|---|
Figure 6. Surface images obtained by AFM technology, for the untreated sample (A), and plasma treated samples at 40 kHz (B) and 1000 kHz (C) |
The results show that the cold plasma generated at 1000 kHz has a better efficiency in obtaining surfaces with higher roughness and modified morphology.
The second polymer type we treated in cold plasma using the generator system we designed and built during this project, is a natural polymer called "k-carrageenan". From this type of polymer we made sheets with the ideea to make patches that can be used for transdermal drug delivery. In the initial polymer matrix we mixed two types of anti inflamatory substances: curcumin and morin. The surfaces of the polymer sheets obtained in this way was treated in high frequency cold plasma with the aim to clean and increase the surfac roughness (the contact area with the skin). The plasma treatment was performed at 1000 kHz, input power 60W, chamber pressure 5 milibar, in synthetic air plasma for 20 seconds. The surface morphology was examined by SEM (INSPECT FEI CO) with the acceleration voltage set to 25 kV. Figure 7 presents the surfaces of the untreated samples (A, B, C) and the cold plasma treated sample surfaces (A1, B1, C1).
Figure 7. SEM images of untreated samples (A, B, C) and cold plasma treated samples (A1, B1, C1). |
|---|
Pictures A and A1 present the k-carrageenan polymer sheet, pictures B and B1 present the polymer sheets containing curcumin and pictures C and C1 show the sample surfaces for the polymer sheets containing morin. As you can see from Figure 7, in case of the undoped polymer sheets (A, A1) and in the case of morin doped polymer (C, C1), the cold plasma treatment has a cleaning/smoothing effect, and in the case of the samples doped with curcumin, the cold plasma increases the surface roughness, the number of striations is almost double after the plasma treatment (B, B1).
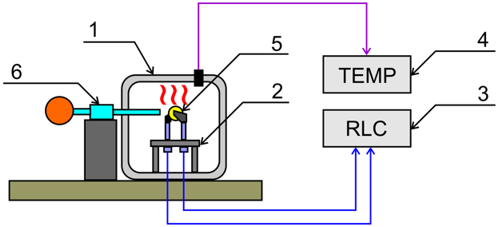
[ 2 ] The first cleaning test of the plasma generated with the reactor designed and built during this project, applied for metallic surfaces, was performed on SnO2 nanoparticles with the aim to improve the adhesion of the particles when they are subjected to mechanical pressure (when forming a sample in the shape of a pill). The goal was the obtaining a semi-solid coin-shaped sample of SnO2 nanoparticles which can function as a gas detector (for volatile organic compounds, i.e. acetone). The experimenal setup we used for this test is presented in Figure 8. In order to find the working temperature under which the nanoparticles can work as a gas detector, we plotted the R=f(T) characteristics (resistance as a function of temperature), and the temperature for which the material's behavior changes from semiconductor to metal is the correct value. The coin-shaped pressed nanoparticle sample (5, Figure 8) is placed in a fixture 2 mounted in an electrically heated oven 1. The temperature inside the oven is measured with the thermometer 4, and the electrical resistance of the sample is measured with the digital RLC meter 3. The sample functioning as a gas detector is proven by spraying acetone vapors with the pump 6. When the sample is at the correct temperature and the vapors hit its surface, the electrical resistance of the sample presents a jump, compared with the resistance value when the vapors are not present. The graph from Figure 9 presents the R=f(T) characteristic recorded for the SnO2 nanoparticle sample used in this test. We found the working temperature for our gas sensor sample to be 215 degrees C.
 |
 SnO2 SENZOR GAZ.jpg) |
|---|---|
Figura 8. Dispozitivul experimental utilizat pentru testarea proprietatilor de senzor de gaz în cazul probei de nanoparticule de SnO2 activate în plasma rece. |
Figura 9. Caracteristica R=f(T) pentru proba de SnO2 utilizata în cadrul testului. |
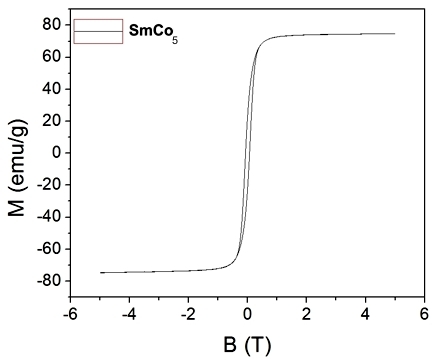
In the second test for the high frequency plasma's cleaning efect we cleaned and passivized SmCo5 magnetic nanoparticles in hydrogen plasma. This type of nanoparticles quickly oxidise in the atmospheric air, so the cleaning must be performed in a plasma generated in an inert gas. We selected the hydrogen as the process gas because of its small sized molecules that can follow the high speed variation of the drive signal (f=1000 kHz), the obtained effect on the nanoparticles being equivalent to the "sand blasting" effect at microscopic level. After the plasma cleaning, we plotted the the magnetization curve of the SmCo5 nanoparticles, the graph from Figure 10a presents the results.
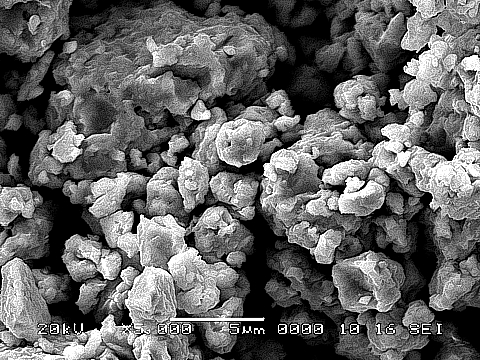
Figure 10b presents the SEM image of the SmCo5 nanoparticles we cleaned in hydrogen plasma, at 0.4 milibar and 80W input power. The cleaning time was 20 minutes.
 |
 |
|---|---|
| (a) | (b) |
| Figure 10. a) magnetization curve for the SmCo5 nanoparticles; b) SEM image of the SmCo5 nanoparticles at 5000x magnification | |